Read the latest statistics on the COVID-19 Outbreak
The politics behind how governments control coronavirus data…

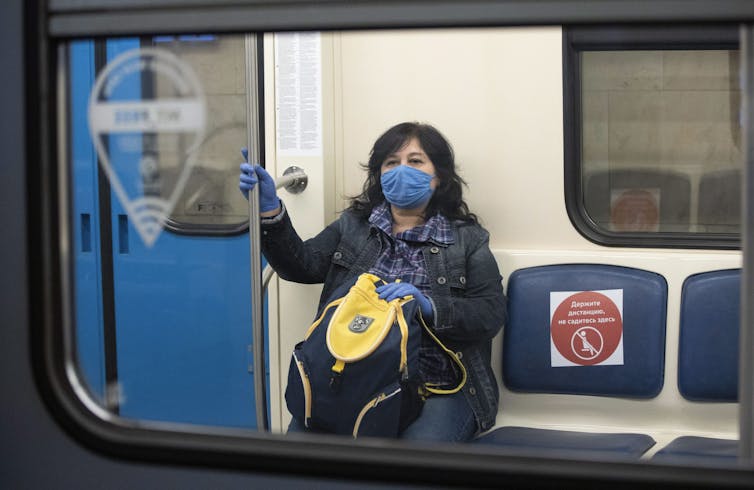
(AP Photo/Alexander Zemlianichenko)
Anton Oleinik, Memorial University of Newfoundland
COVID-19 has affected almost every country around the globe. The World Health Organization has confirmed cases in 216 countries and territories, a total that represents more than 85 per cent of 251 entities recognized by the United Nations. Yet each government has responded differently to the coronavirus pandemic — including how data on the disease have been shared with each country’s citizens.
The selectiveness with which governments release information about the number of confirmed cases and the deaths caused by the coronavirus suggest techniques of “bio-power” may be at play.
French philosopher Michel Foucault invented the concept of bio-power in his lectures at the Collège de France in 1977-78. He defined bio-power as a “set of mechanisms through which the basic biological features of the human species became the object of a political strategy, of a general strategy of power.”
Foucault found an early example of bio-power in the smallpox vaccine developed by the end of the 18th century — one of the first attempts to manage populations in terms of the calculus of probabilities under the banner of public health. While a COVID-19 vaccine is still in the making, the concept of bio-power may help make better sense of how we see governments deal with the ongoing pandemic.
Our perception of the probability of contracting the virus and the chances to recover is shaped by the relevant statistical figures released by our respective governments. Those figures feed the entire spectrum of our own reactions to COVID-19 — including fear and negligence.
A balanced take on COVID-19 and a proper course of action to deal with the pandemic means the information provided by governments must be complete, valid and reliable. Unfortunately, that is not happening in many cases.
When examining how some countries have responded to the pandemic, bio-political factors should be taken into account. This includes how governments are collecting and sharing data about the coronavirus. Let’s look at three countries in particular.
The United States
U.S.A. (pop. 334,798,843)
- CoV19 Reported Cases: 111,820,082
- Current Reported Deaths:(CFR: 1.11%): 1,212,123 cspad.org estimated actual: 1,516,369
- Cured: 109,814,428
- Beta experimental: All time reported + unreported asymptomatic people maybe not sick, not immune, but possibly infectious and including the many people who have had several mild or asymptomatic infections: 606,547,714.43
- 181.17% of the USA may have been infected or even reinfected including reported + estimated unreported mild and estimated asymptomatic (606,547,714.43) human infections, some of which may not have been ill in their first course of the disease, but could have spread the disease.
- 1.11% is USA current Case Fatality Rate (CFR) &
- 0.25% is estimated inferred average Infection Fatality Rate (IFR)
- 1,516,369 estimated total COVID-19 deaths including unreported likely-cause excess deaths. According to projections of IHME, IHME calculation of excess deaths is slightly higher than what CSPaD is estimating.
- CoV19 Cases: 692,174,423
- Deaths: 6,008,579 | 0.95%
- Cured: 525,713,321
- Reported + estimated all unreported 4,446,089,612
Note: Total statistics for the United States do not include these offshore territories. The US Military is included as if it is an offshore territory, not reported as continental USA data but as USA overall totals and included in world totals. FPMag evaluates these separately for many reasons.
| Territory | Cases | Deaths | Recovered |
| Continental US | 109,683,131 | 1,212,123 | 1.11% | 107,745,468 |
| +US Military | 740,942 | 690 | 0.1% | 733,533 |
| +Guam | 61,139 | 420 | 0.7% | 60,681 |
| +Puerto Rico | 1,286,528 | 6,081 | 0.47% | 1,003,492 |
| +US Virgin Islands | 25,389 | 132 | 0.5% | 25,114 |
| +Northern Mariana Islands | 14,594 | 41 | 0.3% | 0 |
| +American Samoa | 8,359 | 34 | 0.4% | 0 |
| Totals | 111,820,082 | 1,219,487 | 109,814,428 |
The American Epicenter including ALL Territories has 0.49 % of global 'active' cases (786,167 USA (incl territories) / 161,246,054 Global), people infected with COVID-19 now.
Abundant proof that vaccines are working, an observation derived from unrelated data analysis.
As the epicenter we look at continental USA together with US territories and without. The significant decline in Case Fatality Rate (CFR) in the continental United States particularly, during 2 0 2 1, since vaccines became available, is believed to be due to vaccination rates and is abundant proof that the vaccines are working.
In order to avoid letting countries that refuse to report the sum of case recoveries, thus skewing global calculations, Burundi, Belarus, Belgium, Bosnia and Herzegovina, Britain, most provinces of Canada, Ecuador, FaeroeIslands, Falklands, Finland, France, French Polynesia, Hong Kong, Iceland, Mongolia, Laos, Netherlands, Norway, Peru, Portugal, Puerto Rico, Ukraine, South Korea, Tunisia, Sierra Leone, Sudan, Spain and Sweden 'recoveries' are estimated based on the current reported global recoveries as a percentage of all cases. (([reported recoveries]) divide (803,994,505 [Global Reported Sum of All Cases] less 39,056,381 [France Sum of Cases] less 1,075,864 [Ecuador Sum of Cases] less 13,980,340 [Spain Sum of Cases] less 8,635,896 [Netherlands Sum of Cases] less 2,754,129 [Sweden Sum of Cases] less 4,572,667 [Peru Sum of Cases])) = 78% a coefficient which is then adjusted according to the number of cases in the past 30 days and the new coefficient is applied to the sum of each of these nation's cumulative cases to estimate the missing recoveries data. In the case of France some additional hospital-sourced recovery data is factored.
| Reported: | ||||
| All USA | Sum of Cases | Deaths | Recovered | Active |
| Continental USA | 109,683,131 | 1,212,123 | 107,745,468 | 725,540 |
| USA+territories | 111,820,082 | 1,219,487 | 109,814,428 | 786,167 |
See The Lancet estimate of excess mortality from COVID-19 (Download PDF) in 191 countries/territories and 252 subnational units of select countries, from 1 January 2 0 2 0, to 31 December 2 0 2 1.
See also IHME Estimates for America.
In the U.S., COVID-19 information is disseminated by government agencies, universities, the media and even search engines.
Various levels of governments remain the ultimate source of the reported figures, but how accurate are those figures?

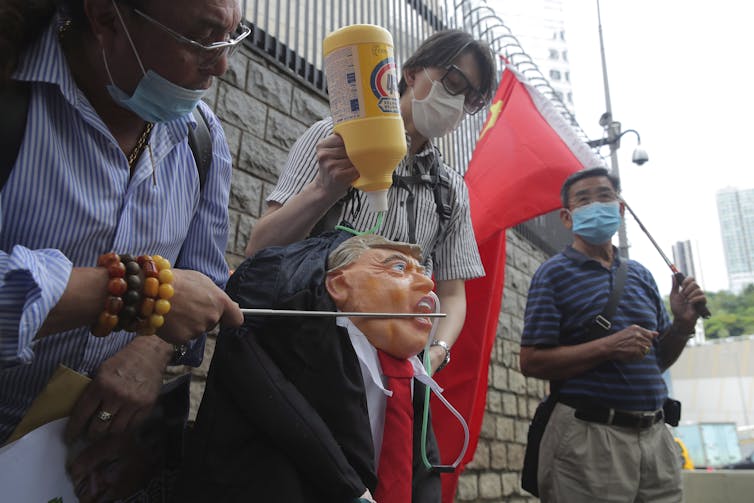
(AP Photo/Kin Cheung)
The U.S. now has the most confirmed cases and deaths caused by COVID-19. While this can be explained by a late response to the pandemic and the lack of universal health care coverage, the political stakes in the COVID-19 crisis are also very high for the U.S.
The social and economic crisis caused by the pandemic will be a major factor in this year’s elections. In an effort to shift attention from his administration’s response, U.S. President Donald Trump has indicated China should be blamed for the crisis. The high number of infections and deaths contribute to a feeling of fear and insecurity — which from a bio-power perspective may actually help Trump sell his message.
Russia
In addition to being the only source of information about COVID-19, the Russian government also makes every effort to protect its monopoly on the production and dissemination of the relevant data. Anyone who attempts to collect and disseminate COVID-19 figures without having a “licence to inform” may face criminal charges for being an agent provocateur.
A group of medical doctors in Chechnya, the previously rebel region in the Caucasus now under the tight control of the central government, attempted to complain about the lack of preparedness to COVID-19. They were promptly accused of “provocations” and forced to deliver public apologies.

(AP Photo/Dmitri Lovetsky)
According to government data, Russia has one of the lowest COVID-19 mortality rates in the world, less than one per cent. (The U.S. reports a six per cent mortality rare; Italy, France and the U.K. are in the range of 14-15 per cent). Either the Russians have an exceptionally strong immune system or something is wrong with the way the government counts the deaths.
As well, the regular monthly statistics of deaths released by some regions shows an anomalous hike in April — numbers that are out of line with the officially approved figures of COVID-19-related deaths.
The gap between the number of officially acknowledged COVID-19 cases and deaths may have political explanations.
Similar to the U.S., the pandemic interferes with the political agenda in Russia. The constitutional referendum engineered to extend Vladimir Putin’s term as Russia’s president was originally scheduled on April 22, but was eventually postponed until July 1.
Putin is trying to make the gambit of accepting high (but not necessarily accurate) figures of COVID-19 infections and simultaneously doing everything possible to under-report the true number of COVID-19-related deaths. If successful, he would be able to claim credit for handling the crisis better than other world leaders.
Canada
Canada’s figures do not look controversial at first sight. The country has neither an exceptionally high number of COVID-19 cases nor an exceptionally high mortality rate (7.5 per cent). But that doesn’t mean there aren’t potentially some elements of bio-power at play.
Population: 41,014,164 adjusted for estimated real COVID-19 deaths
| Canada | Cases | Deaths | Cured | Active |
| Reported: | 4,949,441 | 59,139 1.2% CFR | 4,878,112 | 12,190 |
| Estimate: | 27,370,409 | 76,880 *0.28% IFR | 26,975,959 | 67,411 |
*Inferred IFR is an estimate only. The actual COVID-19 IFR may not be accurately calculated for the entire human race until long after the pandemic has ended.
Below: Extensive Estimates using data from multiple sources.
Beta experimental estimates for Canada. Reported + unreported mild + asymptomatic COVID-19 infections.
The total actual number of infections in Canada including all the untested, unreported, asymptomatic infections is likely greater than 27,370,409 (66.73% of the population) including mild and asymptomatic cases. That would mean the estimated inferred average Infection Fatality Rate: (IFR) is likely around 0.28%
Canadian COVID-19 deaths to 2024-04-25 are estimated to be 76,637 Using estimated IFR of 0.28%. Global average 0.44% Global estimated inferred average Infection Fatality Rate (IFR
76,637 (0.28% IFR) is the CSPaC estimated number of Canadian COVID-19 deaths (based on the inferred IFR) including those deaths unreported as COVID-19). The IHME estimates excess deaths in Canada to reach much higher than CSPaC estimates.
See The Lancet estimate of excess mortality from COVID-19 (Download PDF) in 191 countries/territories and 252 subnational units of select countries, from 1 January 2 0 2 0, to 31 December 2 0 2 1.
76880 Is the CSPaC estimated number of Canadian COVID-19 deaths based on a modified universal algorithm which factors more sophisticated public health infrastructure and also fewer available urgent care beds and facilities which is a problem in much of Canada in an emergency measures context.
The closeness of the two numbers derived from unique data and methods suggests their high probability. The blended data of three projections from three different biostatistician labs also confirms the estimates +/- .01%.
It is safe to say that Canadians have endured the grief of losing 76880 family members. Every number has a face. May their memory be forever a blessing to their families and friends.
Canada's advanced public health standards.
Canada and the USA have Infection Fatality Rates close to global averages but since vaccine booster-rates have dropped, CFR in both countrioes is climbing slightly above global averages. (influenza has an IFR of .1% or 6 per 100k (2019)).
Ontario, Canada Reports no longer updated. See Archives to 5 March 2023
Canada’s government chose to complicate the task of comparing the COVID-19 figures across its provinces and territories. The federal government’s website dedicated to COVID-19 reports the aggregate data only. No death statistics are included. Comparing the responses of each province requires an examination of 13 different provincial websites, which have various formats of reporting the relevant figures.
Access-to-information requests are not of great help here either, despite the fact that there are access-to-information acts both at the federal and provincial levels.
It takes an average of one month to get a response to an access-to-information request under normal times. But now governments have full discretion in deciding what information on COVID-19 to release, as well as when and how to do it.
This means that in Canada, bio-politics manifests itself through the fuzziness of information and, in the absence of clear information, the public is expected to uncritically accept the actions of their governments.![]()
Anton Oleinik, Professor of Sociology, Memorial University of Newfoundland
This article is republished from The Conversation under a Creative Commons license. Read the original article.


